HOME
>
IR Information TOP
> Earnings Data
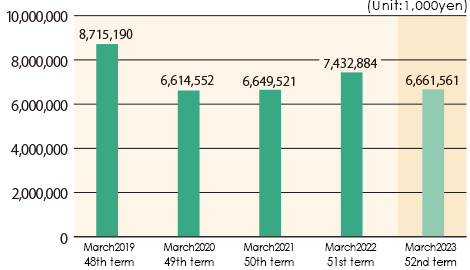
Net sales
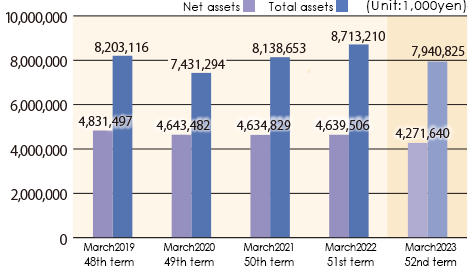
Net assets/Total assets
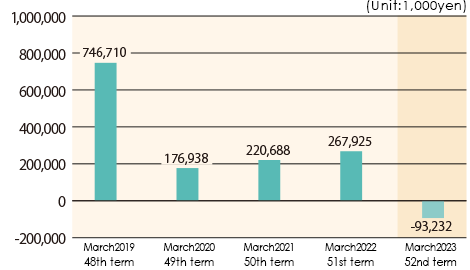
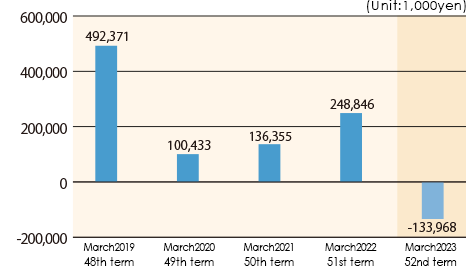
Ordinary income
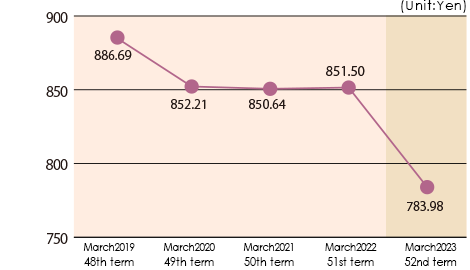
Net assets per share
Net income attributable to owners of parent
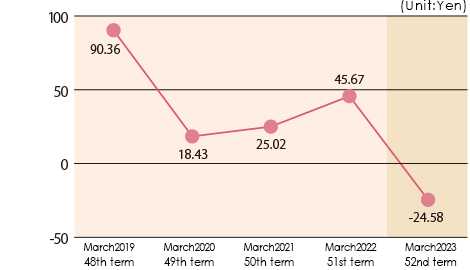
Net income per share
Copyright(c) NIC Autotec.Inc. All rights reserved. .